Label-free HSI for Surgical Margin Assessment
Quantification Tools for HSI During Surgical Guidance
Spectral-Spatial Classification Methods for Tumor Detection
Minimum Spanning Forest Based Method for HSI
Hyperspectral imaging is an imaging modality that holds strong potential for rapid cancer detection during image-guided surgery. But the data from hyperspectral imaging often needs to be processed appropriately in order to extract the maximum useful information that differentiates cancer from normal tissue. We proposed a framework for hyperspectral image processing and quantification, which includes a set of steps including image preprocessing, glare removal, feature extraction, and ultimately image classification. The framework has been tested on images from mice with head and neck cancer, using spectra from 450 to 900 nm wavelength. The image analysis computed Fourier coefficients, normalized reflectance, mean and spectral derivatives for improved accuracy. The experimental results demonstrated the feasibility of the hyperspectral image processing and quantification framework for cancer detection during the animal tumor surgery, in a challenging setting where sensitivity can be low due to a modest number of features present, but potential for fast image classification can be high. This HSI approach may have the potential application in tumor margin assessment during image-guided surgery, where speed of assessment may be the dominant factor.
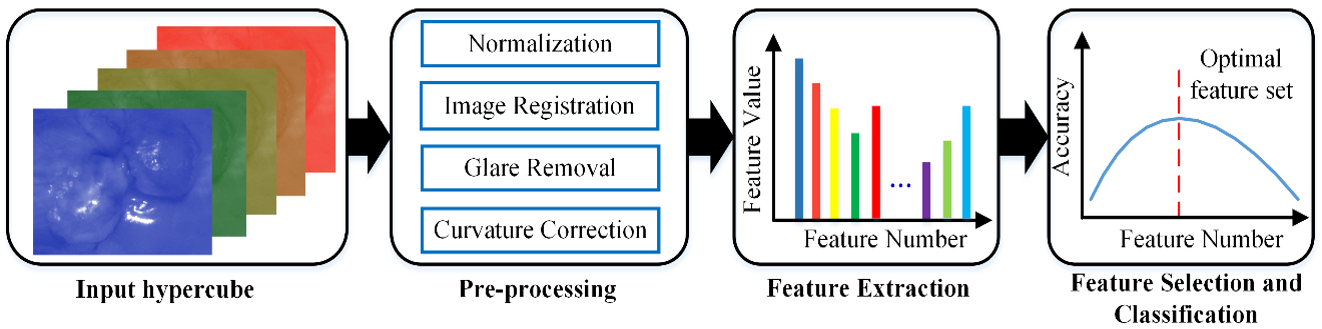
Flowchart of the hyperspectral image quantification tools. HSI data are pre-processed by spectral normalization, image registration, glare detection, and curvature correction. Image features are then extracted from the HSI data and a discriminative feature set is selected and used for the classification of cancer and benign tissue.
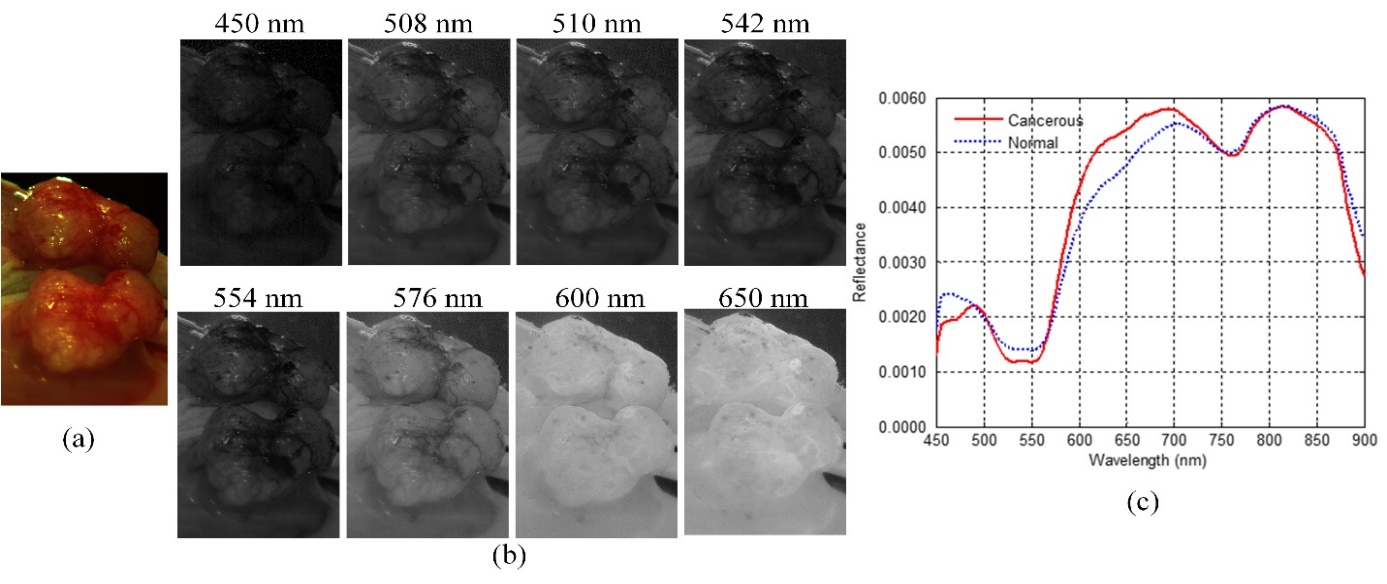
Visualization of a tumor with green florescence proteins (GFP). The upper part is the image of the tumor in a mirror. (a) RGB composite image of the hypercube, (b) Pre-processed spectral images at wavelength 450 nm, 508 nm, 510 nm, 542 nm, 554 nm, 576 nm, 600 nm, and 650 nm. (c) Spectral curve of cancerous and healthy tissue.
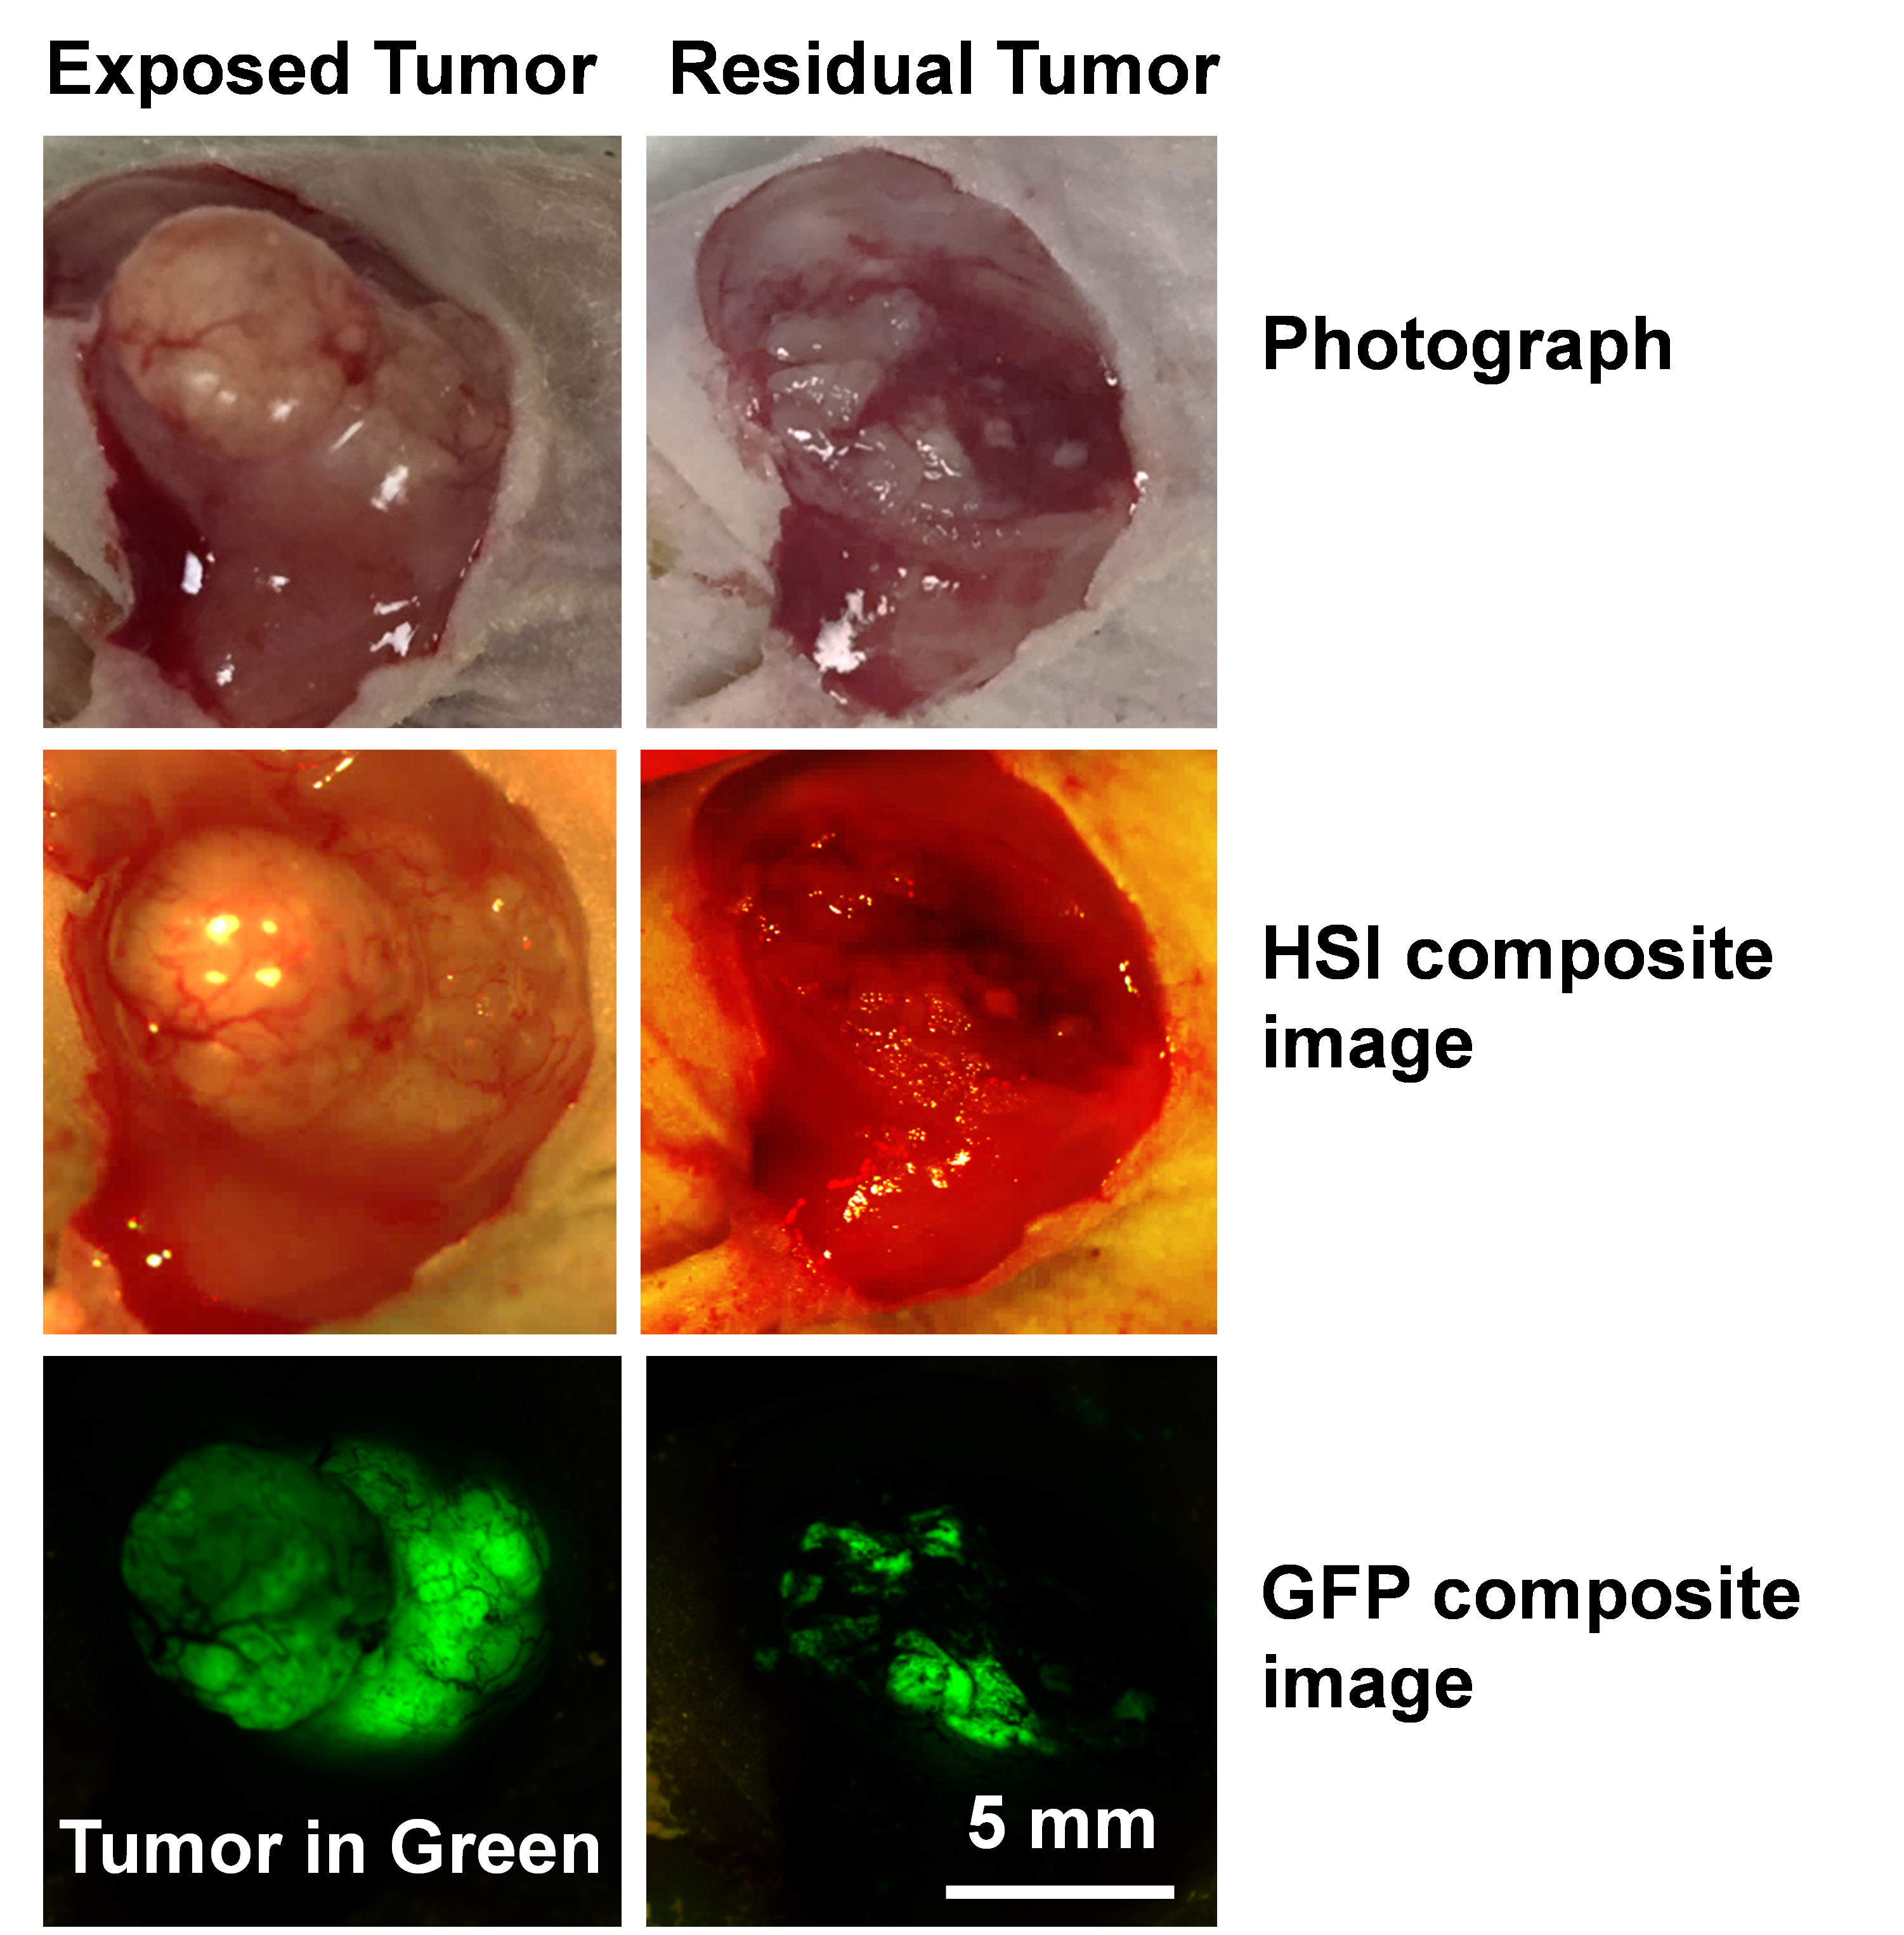
Hyperspectral imaging for the detection of residual tumors in a head and neck cancer animal model. Before and after the exposure of the tumor, hyperspectral images were acquired and processed. The implanted tumor cells had green florescence proteins (GFP). The GFP signals indicated the residual tumor cells and were used to validate the hyperspectral imaging based detection where GFP signals were removed during the HSI data processing.
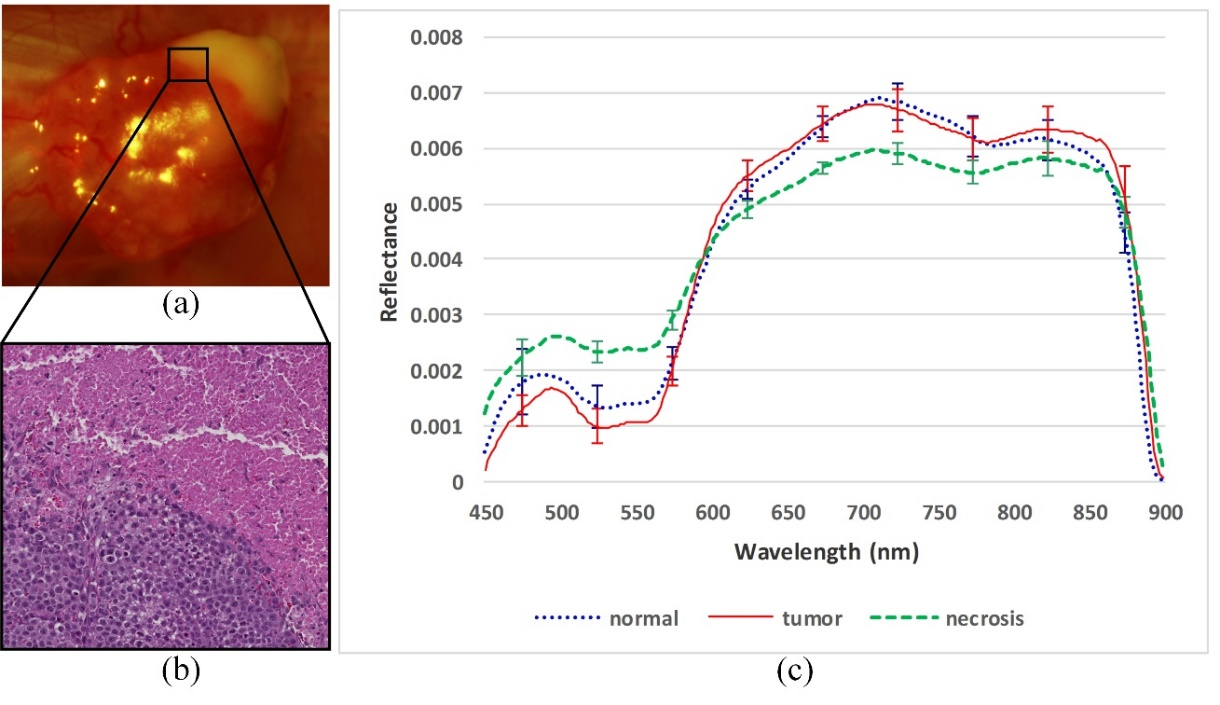
Reflectance spectral curve of a tumor with necrosis. (a) RGB composite image of hypercube. The white region looks necrotic, and the other part of the tumor contains many vessels; (b) Histological image of the rectangular tissue region in (a). The upper part is the necrotic tissue without nuclei, and the lower part is the viable cancerous tissue; (c) The average reflectance spectra of the tumor, necrosis, and normal tissue with standard deviation. The red solid line represents the average spectra of cancerous tissue, and the blue dotted line represents the average spectra of the normal tissue. The green dashed line represents the average spectra of the necrosis tissue. The error bars are the standard deviations at certain wavelength of the three curves.