
Label-free HSI for Surgical Margin Assessment
Quantification Tools for HSI During Surgical Guidance
Spectral-Spatial Classification Methods for Tumor Detection
Minimum Spanning Forest Based Method for HSI
Hyperspectral imaging (HSI) also called imaging spectrometer is an emerging imaging modality for medical applications. HSI has been explored for various remote sensing applications by NASA. With the advantages of acquiring two dimensional images across a wide range of electromagnetic spectrum, HSI has been applied to archaeology and art conservation, vegetation and water resource control, food quality and safety control, forensic medicine, crime scene detection, and biomedical areas, etc.
HSI offers great potential for non-invasive disease diagnosis and surgical guidance. Light delivered to the biological tissue undergoes multiple scattering from inhomogeneity of biological structures and absorption primarily in hemoglobin, melanin and water as it propagates through tissue. It is assumed that the absorption, fluorescence and scattering characteristics of tissue change during the progression of disease, therefore the reflected, fluorescent and transmitted light from tissue captured by HSI carries quantitative diagnostic information about tissue pathology. In recent years, the advancements of hyperspectral cameras, image analysis methods and computational power make it possible for many exciting applications in the medical field.
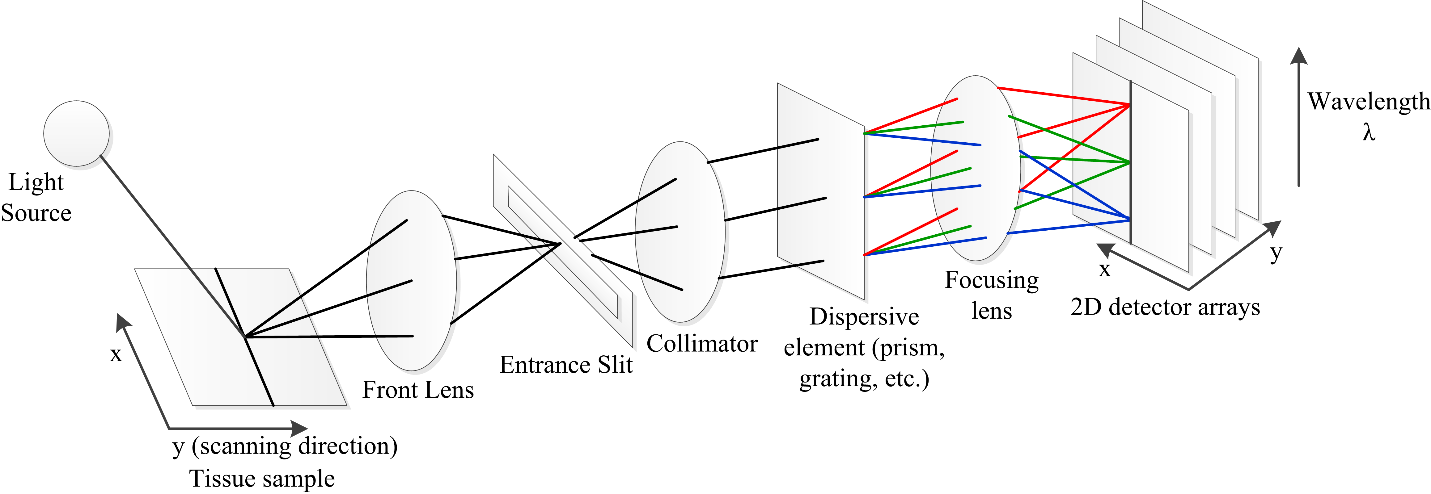
Schematic diagram of a pushbroom hyperspectral imaging system
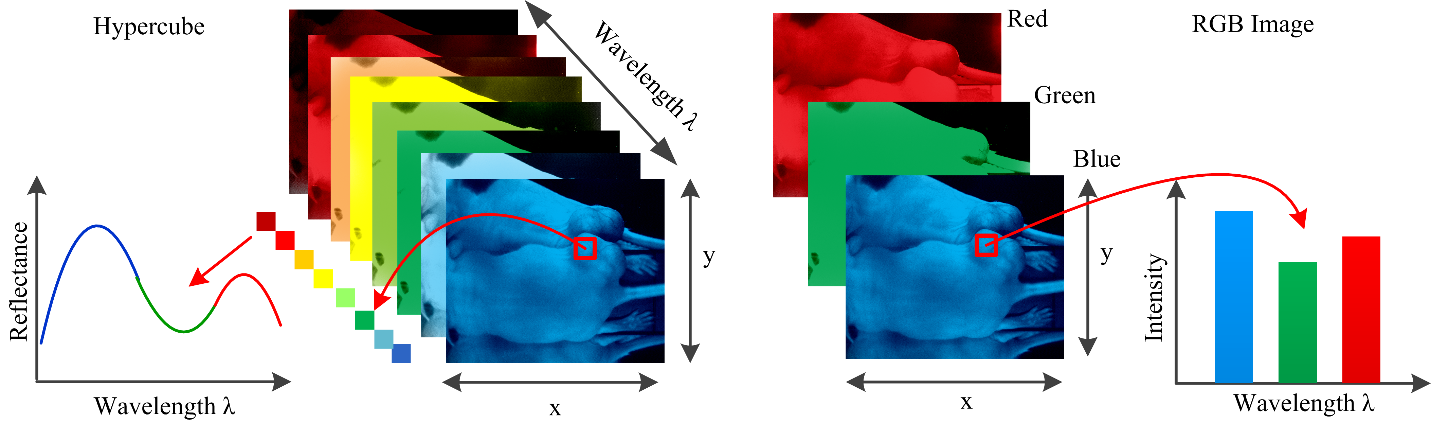
Comparison between hypercube and RGB image. Hypercube is three dimensional dataset a 2D image on each wavelength. The lower left is the reflectance curve (spectral signature) of a pixel in the image. RGB color image only has three image bands on red, green and blue wavelength respectively. The lower right is the intensity curve of a pixel in the RGB image.
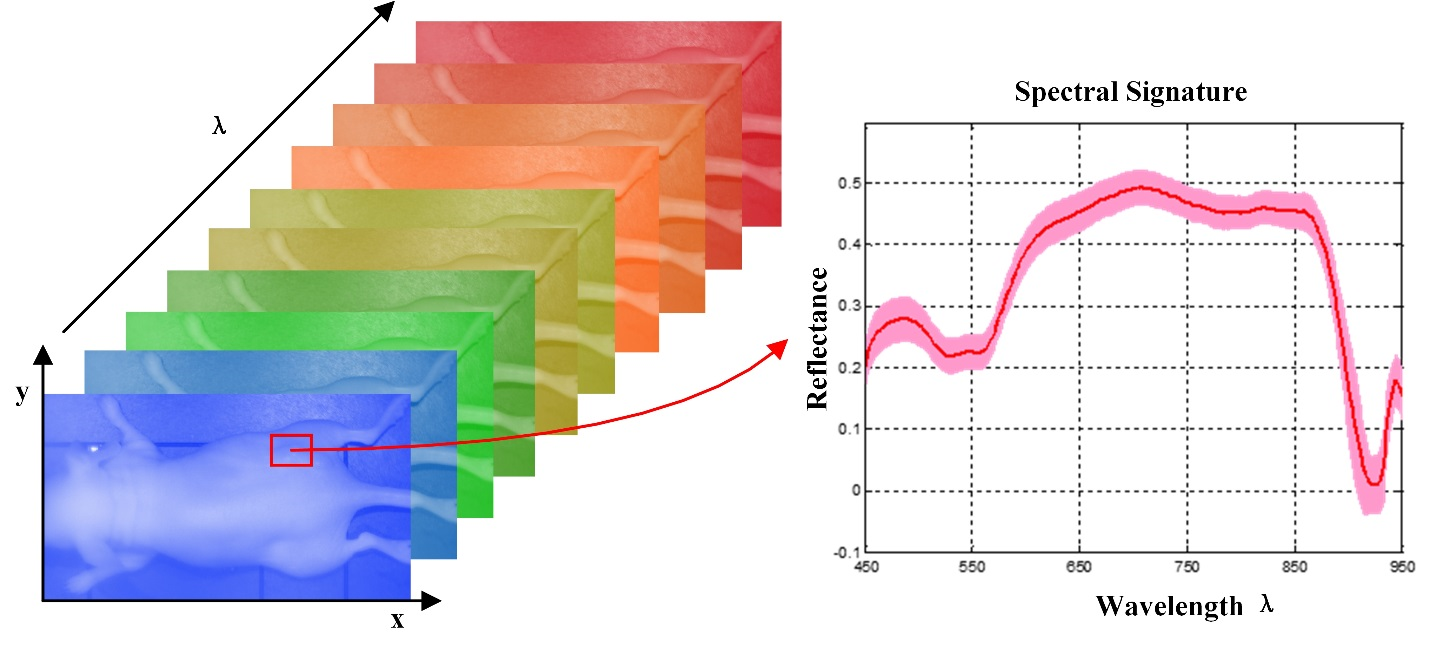
The data structure of a hypercube of hyperspectral imaging. The red solid line represents the average reflectance spectrum of the rectangular region of the tumor tissue in the mouse, and the color region around the solid line represents the standard deviation of the spectra in the same region.